
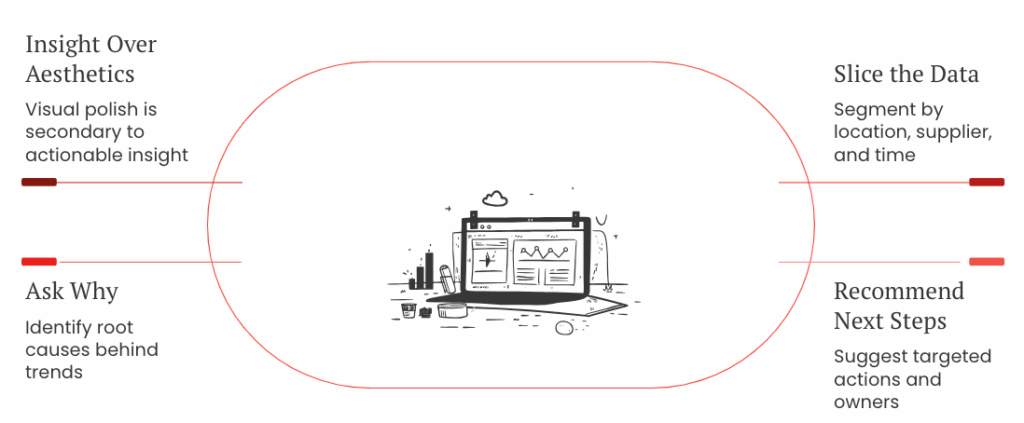
Procurement dashboards often look sleek, colorful charts, up-to-date metrics, and trend lines that look impressive in meetings. But the real power of a dashboard isn’t in the data it shows, it’s in how the data is sliced and framed. A well-designed dashboard answers more than “how much” or “how many”, it gets to “where,” “why,” and “what next?” That’s where data lenses come in.
How you cut procurement data, by category, supplier, region, or contract, dramatically shapes what you see and how you act.
The same dataset can tell multiple stories depending on the perspective applied. In this post, we explore the most useful lenses in strategic procurement and how they unlock insights that generic dashboards miss.
Once you’ve defined the right strategic questions (Part 1) and chosen the KPIs that matter (Part 2), the next step is to view those KPIs through the right lenses. Without that, numbers remain flat and abstract. With the right cuts, they reveal risks, inefficiencies, and opportunities that change decision-making.
Why How You Cut Your Procurement Data Matters More Than You Think
Let’s say you’re tracking total spend.
On the surface, you know how much your organisation is purchasing. Great.
But now break that down by supplier, and suddenly you see you’re spending 60% of a category with a single vendor.
Or slice it by region, and you realise one office is consistently going off-contract.
These aren’t just facts, they’re signals.
What you don’t see in procurement often costs you the most.
Without slicing, you see only flat averages. With slicing, patterns of risk, inefficiency, and opportunity come into focus. Dashboards that enable these multiple perspectives turn passive reporting into active insight.
Common Data Lenses in Procurement
Here are six of the most useful and widely applicable lenses you should build into your procurement dashboards:
1. “By Spend Category: Finding Cost Savings Through Category Management”
This is the foundation of any spend analysis. Understanding what you’re buying, and in which categories you’re spending most, helps with prioritisation and sourcing strategy.
- Reveals opportunities to consolidate vendors or standardise specifications
- Highlights categories with poor compliance or growing costs
- Enables better category management by showing trends, volume, and performance
Insight: A dashboard shows that “Professional Services” accounts for 25% of indirect spend across business units, but is split among 15 different suppliers. That’s a clear opportunity for consolidation and negotiation.
Beyond immediate consolidation or compliance benefits, category views create strategic leverage.
They show procurement leaders not only where money is going, but where the organisation can shape outcomes at scale. A handful of categories usually account for the majority of spend, and therefore the majority of risk and opportunity. Seeing these concentrations clearly allows procurement to prioritise negotiations, design category strategies, and reallocate effort where it matters most.
Category slicing also bridges functions.
Finance uses it to track budget alignment, Operations to monitor continuity of supply, and business units to benchmark performance against peers. The same lens creates a shared fact base that moves conversations away from opinion and toward evidence-based decisions.
Finally, category lenses lay the groundwork for predictive analytics. By combining category spend with external indices, commodity prices, inflation forecasts, or demand trends, procurement can run scenarios and anticipate shifts before they hit the bottom line. It’s the difference between reporting where spend has gone and steering where spend is going next.
Different cuts of the same data tell completely different stories.
2. By Spend Category: Finding Cost Savings Through Category Management
Looking at data by supplier answers the question: who are we buying from, and are they performing?
- Identifies over-reliance on single-source suppliers (risk)
- Evaluates supplier performance (on-time delivery, SLA compliance)
- Tracks how much value key suppliers deliver compared to spend
Insight: Supplier X is responsible for 30% of logistics spend but has a 78% on-time delivery rate, well below average. Time to investigate or source alternatives.
Supplier views aren’t just about spotting weak performance, they’re about strategically managing the supply base.
A supplier lens helps leaders distinguish between strategic partners, preferred suppliers, and transactional vendors, and allocate management effort accordingly. High-value suppliers can be assessed not only on delivery and compliance, but on the innovation, resilience, or sustainability benefits they bring to the organisation.
This view also underpins supply chain continuity. Over-reliance on a single supplier creates not only operational risk but also reputational and financial exposure, now a board-level resilience priority. By combining supplier performance data with risk ratings, financial health, geopolitical exposure, ESG compliance, procurement can flag vulnerabilities early and shape mitigation strategies before disruption occurs.
In practice, supplier lenses evolve from simply measuring “are they delivering?” to guiding “how do we deepen partnerships, reduce concentration risk, and align suppliers with long-term value creation?”
3. By Region or Business Unit: Benchmarking Procurement Across Geographies
Geographic or departmental lenses show how procurement behavior varies across the organisation.
- Uncovers regional compliance gaps or pricing inconsistencies
- Supports internal benchmarking and accountability
- Helps tailor strategies to local market conditions or team behaviors
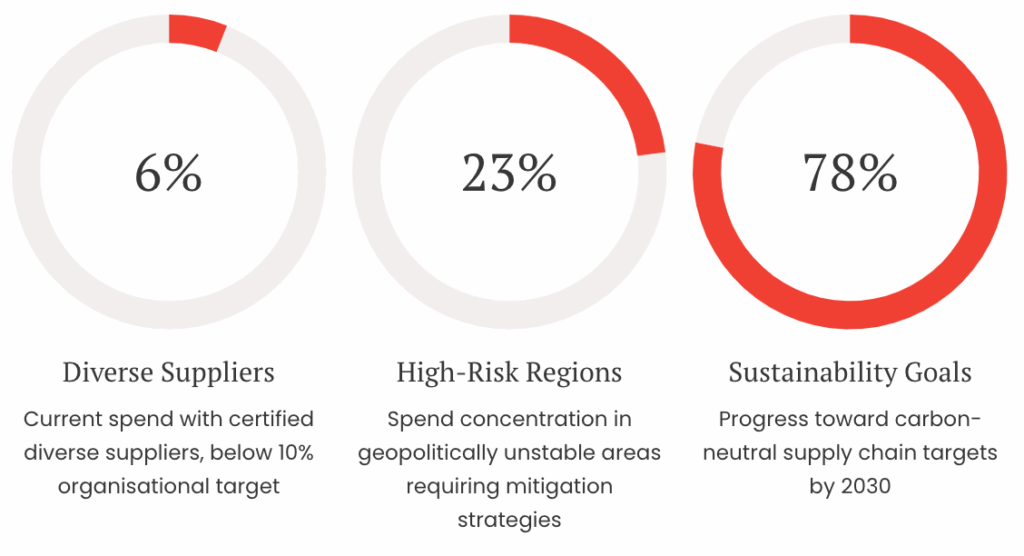
Insight: Asia-Pacific consistently sources locally at higher costs compared to Europe due to lack of awareness of corporate contracts. A training or enablement initiative may be needed.
Regional or business unit views do more than flag compliance issues, they create accountability.
By showing performance transparently across entities, they introduce a “league table” effect where underperforming units are motivated to close the gap, and best practices from high performers can be scaled across the organisation.
This lens also highlights the tension between global and local. Some categories benefit from global contracts and consolidated leverage, while others require local tailoring to meet market, cultural, or regulatory needs. A regional dashboard view helps leaders strike the right balance, identifying where global standards drive efficiency, and where local autonomy delivers resilience or innovation.
Finally, regional slicing is a powerful risk management tool.
Certain geographies carry higher exposure to regulatory changes, ESG scrutiny, or supply chain disruptions. Dashboards that surface spend and supplier dependency in these regions give executives a proactive way to mitigate enterprise risk before it escalates.
Category lenses reveal where procurement can shift enterprise value at scale.
4. By Contract Compliance: Stopping Maverick Spend Before It Grows
A compliance lens compares actual spend against preferred suppliers and contracts.
- Tracks % of spend on vs. off contract
- Highlights departments with high maverick spend
- Measures contract utilisation rates
Insight: One dashboard view shows that Marketing has 45% of spend going to non-contracted vendors, while Operations is at 5%. That points to gaps in policy enforcement or contract suitability.
A contract compliance view goes further than identifying maverick spend, it exposes and plugs the leaks that drain savings and negotiating power.
When procurement can track non-compliance with precision, they can quickly calculate the cost impact of missed opportunities: the overpayment from going off-contract, the lost value from unused terms, and the leakage from inefficient sourcing processes.
But the compliance lens does more than flag poor performance, it uncovers where policy enforcement gaps exist. Is the issue one of awareness, with some departments unaware of existing contracts? Or is it a matter of accountability, are there weak governance structures that allow teams to bypass policies? Tracking compliance by department not only highlights where problems exist but also flags where improved training, enforcement, or contract suitability may be required.
Finally, compliance tracking goes beyond identifying issues, it’s also about future-proofing contracts. As contracts age or market conditions shift, compliance data reveals where terms are no longer optimal, driving proactive renegotiations and supplier performance reviews to keep contracts in line with current business needs.
5. By Time Period: Tracking Procurement Trends Over Time
Temporal slicing adds context, how performance changes over time is often more revealing than static metrics.
- Spot trends, seasonality, or sudden shifts
- Track progress against procurement initiatives or goals
- Measure impact of sourcing decisions over time
Insight: After onboarding a new supplier, defect rates dropped 20% over three months. That supports further expansion of the relationship.
Temporal slicing is more than hindsight, it’s a tool for foresight.
By tracking how performance evolves over time, procurement leaders gain insights not just into what happened, but into what will likely happen next. For example, early improvements in supplier defect rates can signal a trend toward higher-quality outcomes, while seasonality trends may highlight upcoming market shifts or cost changes.
Time-based views are essential for validating sourcing strategies.
Did the new supplier meet expectations over time? Are cost-saving initiatives showing expected returns? By measuring procurement decisions over several periods, procurement teams can identify not just short-term wins, but long-term, strategic successes, or failures.
Moreover, temporal slicing empowers real-time course correction.
For example, if an expected price drop doesn’t materialise, procurement can dig deeper into the data and pivot to a different strategy before it impacts budgets or operations. Ultimately, this lens allows procurement teams to proactively steer sourcing strategies and procurement practices toward alignment with broader business goals, such as cost savings, risk reduction, and sustainable sourcing.
6. By Risk, Diversity, or Sustainability: Building Resilient and Responsible Supply Chains
More advanced dashboards include ESG-related slices that align with organisational values and compliance mandates.
- Tracks spend with diverse suppliers (minority-, women-, or Indigenous-owned)
- Highlights environmental or geopolitical risks in the supplier base
- Measures progress on sustainability targets
Insight: Only 6% of total spend currently goes to certified diverse suppliers, below the organisation’s 10% target. Strategic sourcing can address the gap.
Risk, diversity, and sustainability lenses go beyond compliance, they define procurement’s role in shaping enterprise resilience and reputation.
Leading organisations now treat ESG and supplier risk management as competitive advantages, not just obligations. A dashboard that flags concentrations of spend in high-risk regions or low engagement with diverse suppliers doesn’t just inform procurement, it informs the board’s risk agenda and the organisation’s license to operate.
Dashboards don’t just report problems, they reveal them.
This view also future-proofs the supply chain.
By integrating supplier data with external risk signals, such as climate vulnerability indices, regulatory exposure, or social impact metrics, procurement can anticipate disruptions before they materialise. It’s the difference between scrambling after a crisis and steering ahead of one.
Finally, dashboards that track diversity and sustainability progress provide a measurable link between procurement and organisational values. For investors, regulators, and customers, these metrics are proof points of commitment. For procurement leaders, they are levers of influence, showing how procurement can drive both business performance and societal impact.
Case Examples: What Different Lenses Reveal
- A supplier lens exposed a critical over-reliance on one vendor for IT hardware. When that supplier experienced delays, it led to widespread disruption.
- A regional lens showed one business unit consistently paying above market price for fleet services. Turns out they weren’t using the corporate contract.
- A compliance lens flagged a spike in maverick spend in Q2. Further investigation revealed that contracts were expiring without being renewed, forcing buyers to go off-contract.
These are the kinds of issues that surface only when data is broken down purposefully. The dashboard didn’t just report them, it revealed them.
These examples aren’t one-offs, they’re patterns seen across procurement functions worldwide. Over-reliance on a single IT vendor is more than a procurement concern, it’s an operational continuity risk for the entire business.
Regional overpayment doesn’t just hurt budgets, it undermines Finance’s cost discipline and creates inequities across business units. Contract lapses aren’t only about maverick spend, they expose the organisation to compliance and reputational risks.
When dashboards enable purposeful slicing, they transform procurement data from surface-level reporting into a diagnostic tool. They don’t just show what happened; they reveal why it happened, and where leaders need to intervene to protect value and resilience.
Designing Dashboards for Easy Pivot/Filter Views
To support these perspectives, dashboards need to be designed for interactive exploration. Build in:
- Filters: Let users view data by category, region, supplier, or date
- Drill-downs: Clicking on a chart element opens more detailed data (e.g. spend by sub-category or department)
- Tabs or toggles: Different views for different audiences, e.g. exec summary vs. operational detail
- Consistent structure: Maintain layout conventions across views for usability
The goal is to empower users to answer questions in the moment, not just look at static reports. That’s when dashboards become decision-making tools.
Designing dashboards for pivots and filters isn’t only about usability, it’s about shifting procurement from gatekeeper to enabler. When stakeholders can explore data themselves, slicing by region, drilling into suppliers, toggling between executive and operational views, they take ownership of the insights. This reduces the endless demand for custom reports and shortens decision cycles. Instead of waiting days for analysis, leaders can test hypotheses in real time: “What if we consolidated suppliers in APAC?” or “Where exactly is compliance breaking down?”
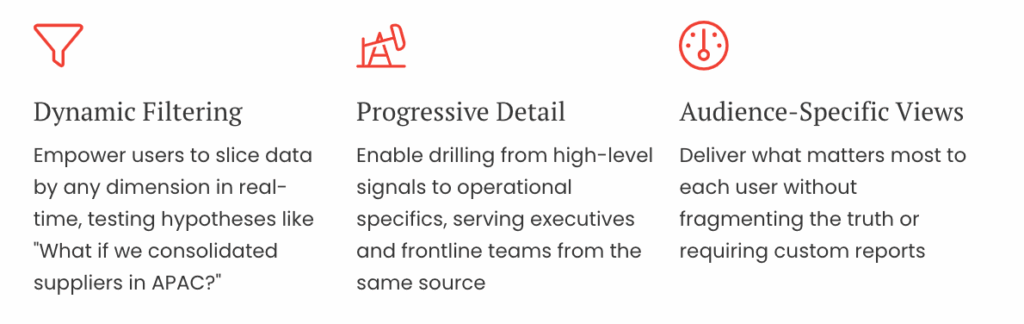
Equally important, multi-lens design ensures each audience sees what matters most without fragmenting the truth. Executives need high-level signals; category managers need process visibility; frontline teams need operational detail. Well-structured pivots deliver all three, turning the dashboard from a static report into a living decision tool.
Which three data slices reveal the most in your organisation? Think about the last time procurement made a strategic decision, what lens revealed the insight that mattered?
Dashboards without lenses show numbers. Dashboards with lenses show meaning.
By slicing procurement data through categories, suppliers, regions, compliance, time, and ESG, leaders uncover risks, opportunities, and strategic signals that aggregates alone can never reveal. The right lens transforms a static report into a decision-enabling tool, one that tells you not just what is happening, but why it’s happening and where to act next.
In Part 4, we’ll explore how to visualise these insights in ways that are instantly clear and compelling. Because seeing differently is the first step, but communicating clearly is how dashboards truly drive action.
Are your dashboards showing you what matters, or just showing you everything?
At PI Data Analytics, we help procurement teams design dashboards with the right lenses so hidden risks, opportunities, and insights surface clearly.
Book a consultation. Let’s build dashboards that reveal the “why” and “what next,” not just the “what.”
Get Procurement Insights That Matter
Join 10,000+ procurement professionals getting monthly expert cost-optimisation strategies and exclusive resources. Unsubscribe anytime.
JoinFollow us