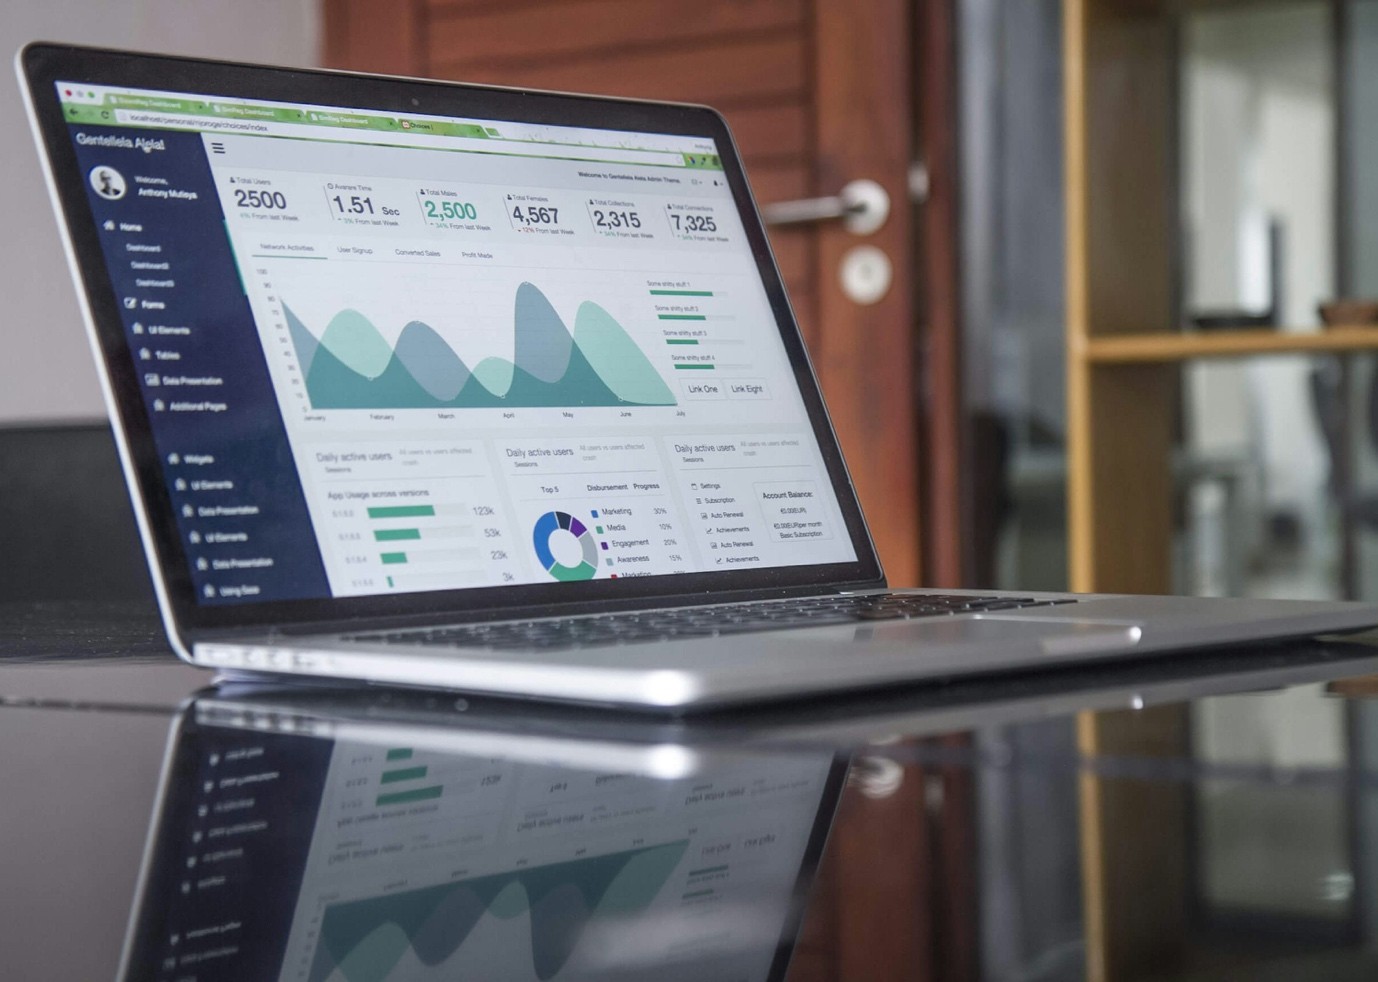
Walk into any procurement office and you’ll see them everywhere: dashboards glowing on monitors, printed in slide decks, proudly displayed in boardroom presentations.
Colourful charts, trending lines, impressive data visualisations that look like they belong in a sci-fi movie.
Here’s what you may not see: anyone actually using them to make decisions.
The dirty secret of procurement dashboards? Most of them are gorgeous failures.
They’re built by people who confused “looking impressive” with “being useful.”
They display everything and reveal nothing. They answer questions nobody asked while ignoring the ones that actually matter.
Your dashboard isn’t a piece of art for the office wall. It’s supposed to be the nerve center of your procurement strategy, the place where data becomes insight, insight becomes action, and action drives results.
But that only happens when you start with the right foundation: not what data you have, but what decisions you need to make.
Why Procurement Dashboards Fail: Pretty but Pointless
Most procurement dashboards die the death of irrelevance because they were built around data rather than strategy.
A designer throws every available metric onto one screen, hoping something will be useful. The result? A cluttered display where nothing stands out, and users end up ignoring it.
This problem is especially visible in procurement, where complexity abounds categories, suppliers, contracts, compliance, risk scores, budgets, and savings.
If the dashboard doesn’t focus on actionable insights, it becomes just another reporting tool, one that takes time to maintain but delivers sero value.
A dashboard without purpose isn’t strategic. It’s just noise dressed up in fancy graphs.
Asking the Right Questions for Procurement Visualisation
The single most important step in designing a meaningful procurement dashboard is defining the questions it must answer.
Forget the data you already have, start with the decisions you need to support. In strategic procurement, the right questions often look like:
- Cost Savings: Where are the biggest cost-saving opportunities right now? Are we hitting our savings targets?
- Compliance: How much maverick spend is happening outside contracts? Which departments or regions are least compliant?
- Supplier Risk: Which suppliers pose the greatest risk to operations (e.g., single-source dependencies or poor performance)?
- Contract Performance: Which contracts are underutilised or coming up for renewal?
Once you have clear questions, you can work backwards to identify the data and KPIs needed. The dashboard becomes a decision-making tool rather than a random collection of charts.
Aligning Your Procurement Dashboard with Organisational Objectives
Procurement dashboards shouldn’t exist in a vacuum, they need to reflect the priorities of the organisation.
For government agencies, that might mean focusing on transparency, supplier diversity, and compliance with policy. For not-for-profits, it might mean cost efficiency and ethical sourcing. For medium-to-large enterprises, it could be cost savings, supplier performance, and risk management.
Ask yourself: What keeps leadership up at night?
If your CFO is concerned about cost leakage, your dashboard better have a clear story on spend under management and savings achieved.
If compliance and accountability are the focus (especially in government and NFP sectors), metrics around contract adherence and supplier diversity need to be front and center.
What keeps leadership up at night? That’s what belongs on your dashboard.
The dashboard should tell a story that resonates with decision-makers at every level. Aligning it with organisational goals not only ensures its relevance but also increases adoption, people will actually want to use it.
Choosing KPIs That Matter to Your Audience
Selecting Procurement KPIs is where dashboards often go wrong.
The temptation is to include every possible metric, but that just overwhelms users. Instead, focus on a handful of KPIs that directly connect to your strategic questions.
For example:
- Spend Under Management (SUM): Are we buying through approved channels?
- Savings vs. Target: Are our sourcing initiatives delivering measurable financial value?
- Supplier Performance Metrics: On-time delivery, defect rates, and SLA compliance tell us if suppliers are meeting expectations.
- Contract Compliance: How much spend is off-contract (maverick spend) and where is it happening?
Each KPI should be actionable. If a metric moves in the wrong direction, the procurement team should know what to do about it. A dashboard that can’t drive action is just decoration.
Connecting Procurement Metrics to Strategy
Here’s where most procurement dashboards miss the mark: they don’t connect metrics to bigger strategic outcomes.
A drop in supplier performance isn’t just a number, it’s a risk to operational continuity.
An increase in maverick spend isn’t just non-compliance, it’s wasted money and reduced negotiating power.
Your dashboard should make these connections obvious. For example, a high-level KPI like “% of spend under contract” can be tied to strategic goals like cost control and risk mitigation. Savings metrics can be directly linked to organisational efficiency or cost-to-serve targets.
Think of your dashboard as a bridge between raw procurement data and executive priorities. When it’s clear how metrics map to strategy, the dashboard becomes indispensable rather than ignored.
The next time someone shows you a procurement dashboard, don’t ask “What does it measure?” Ask “What decisions does it drive?”
The difference between a pretty dashboard and a powerful one isn’t in the design, it’s in the thinking that comes before the first chart gets drawn.
When you start with strategy, align with what actually matters, and focus relentlessly on actionable insights, you don’t just get better visibility. You get competitive advantage.
Your procurement team is drowning in data but starving for insight.
The right procurement dashboard doesn’t just show you what happened, it shows you what to do next.
Before you design a single chart, define the three strategic questions your dashboard must answer. What insights, if visible on one screen, would make your team smarter and faster in decision-making? Write them down. Build for those. Everything else is just noise wearing a business suit.
What story do you want your dashboards to tell?
At PI Data Analytics, we help you define the right questions-and design dashboards that answer them.
Let’s map your story, not just your data.
Get Procurement Insights That Matter
Join 10,000+ procurement professionals getting monthly expert cost-optimisation strategies and exclusive resources. Unsubscribe anytime.
JoinFollow us